

Today we’re announcing the availability of a new open source module that enables real-time insights into Model Context Protocol (MCP) traffic processed by NGINX. This capability empowers NGINX operators to trace and monitor activity from AI agents, enabling the ability to spot error-prone agents, high latency MCP tools, throughput disparities between MCP servers, and much more.
Unlike traditional application traffic, agentic workloads are highly dynamic and non-deterministic. Agents may invoke different tools, fan out requests, or shift usage patterns in response to context, model behavior, or upstream data. Further, shadow agents from unknown sources can lead to unplanned workloads or expand security risk profiles. This variability makes it difficult to track performance, reliability, cost, and security using conventional observability approaches alone.
MCP introduces a standardized way for AI agents to discover, request, and consume tools and data across distributed systems. This standardization is quickly becoming foundational as AI agents evolve from isolated experiments into always-on, production-grade clients.
The rise of MCP therefore creates an urgent need for agentic infrastructure observability and governance. Operators must be able to answer new questions like which agents are generating traffic? Which MCP tools and servers are bottlenecks? From where are errors originating, and how do they propagate across agentic workflows? Without clarity at the MCP layer, these systems become opaque, harder to scale, and riskier to operate. Providing visibility into MCP flows is essential to ensuring that agent-driven systems remain predictable, secure, and performant as they move into mainstream production environments.
To provide operators with the right tools for tracking agent behavior, the new Agentic Observability module inspects MCP traffic as it happens and reports on throughput, latencies, errors and traces. Crucially, these metrics can be categorized by:
- Agentic clients
- Agent-based sessions
- MCP servers
- MCP tools
Operating directly within NGINX and leaning on our native OpenTelemetry module, these new capabilities don’t require the installation of additional Layer-7 proxies into the data path, providing a frictionless method for observing AI agent traffic.
Agentic Observability Module
The Agentic Observability module is an NGINX JavaScript module coupled with a reference implementation. The core functionality parses traffic from MCP clients, extracting MCP tool names, error statuses, client and server identities. It then leverages the native NGINX OpenTelemetry (OTel) module to package and export insights as span attributes. The reference implementation extends this infrastructure with an OTel collector that subsequently emits observability data to a Prometheus data store. Finally, a Grafana-based front-end pulls relevant data from Prometheus and renders it into a collection of dashboards for real-time consumption of insights.
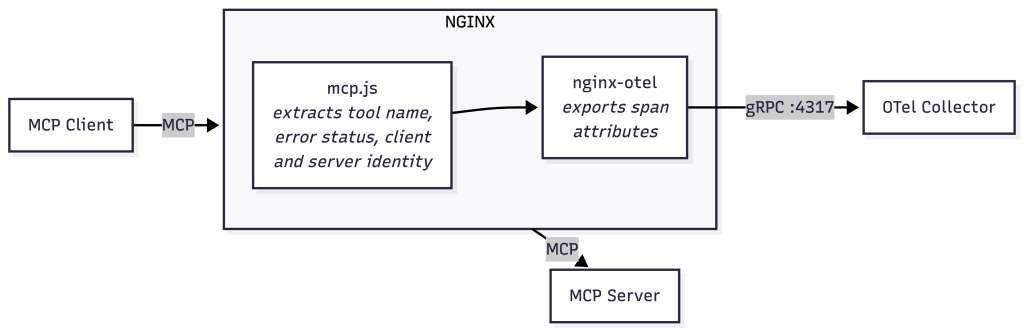
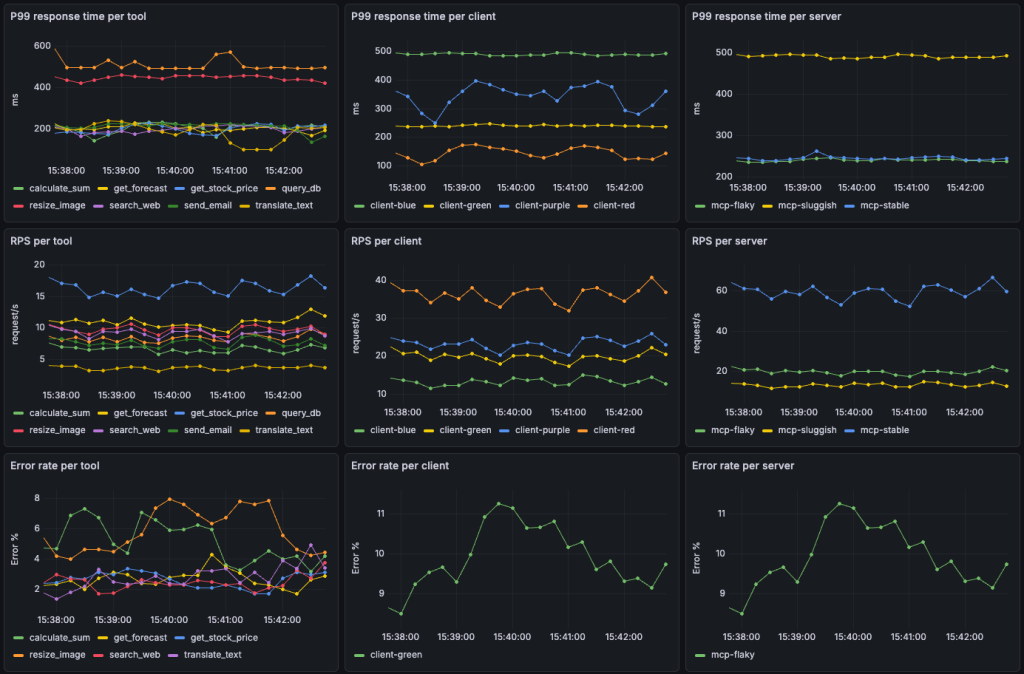
The example screenshot below shows how collected data can inform operators on MCP tool, server and agentic client workload statistics. Next, let’s examine some common agentic infrastructure scenarios and see how the Agentic Observability feature-set can help optimize workloads.
Spotting High-Latency MCP Tool Calls
MCP tool calls can result in a wide variety of downstream workloads. Some tool calls might return static artifacts, others can lead to database queries of varying complexity, while others still can launch cascading search queries. Understanding latency at the MCP tool level is critical to ensuring a high-quality user experience, but data from individual MCP servers or HTTP traces doesn’t provide the aggregate information operators need to identify problematic workloads. From the example graph below, we can easily conclude that the query_db and resize_image tools calls result in a degraded experience, allowing us to take action by optimizing or increasing compute associated with these tools.

Identifying MCP Server Error Trends
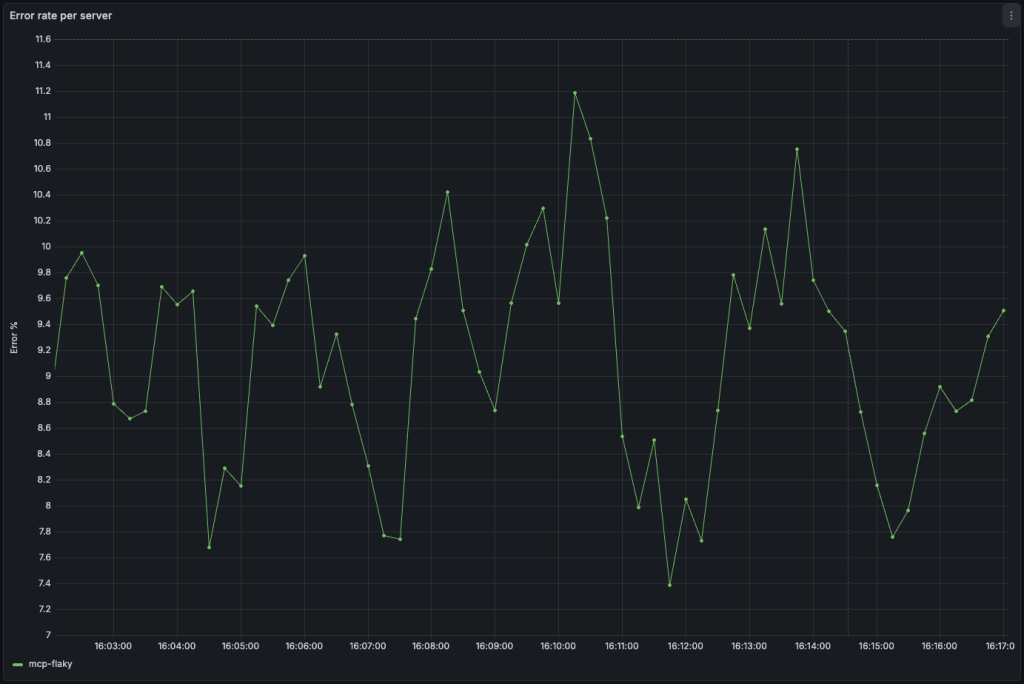
While NGINX has long had the capability to report on backend server errors, the MCP protocol defines a method for application-level error responses to tool calls. The Agentic Observability module is capable of collecting and reporting on error information packaged in MCP responses. The example in the graph below shows that a particularly error prone MCP server called “mcp-flaky” is showing that a high percentage of MCP calls are resulting in errors, while other servers in the backend pool are not, prompting further investigation into the problematic server.
Understanding Agent Throughput
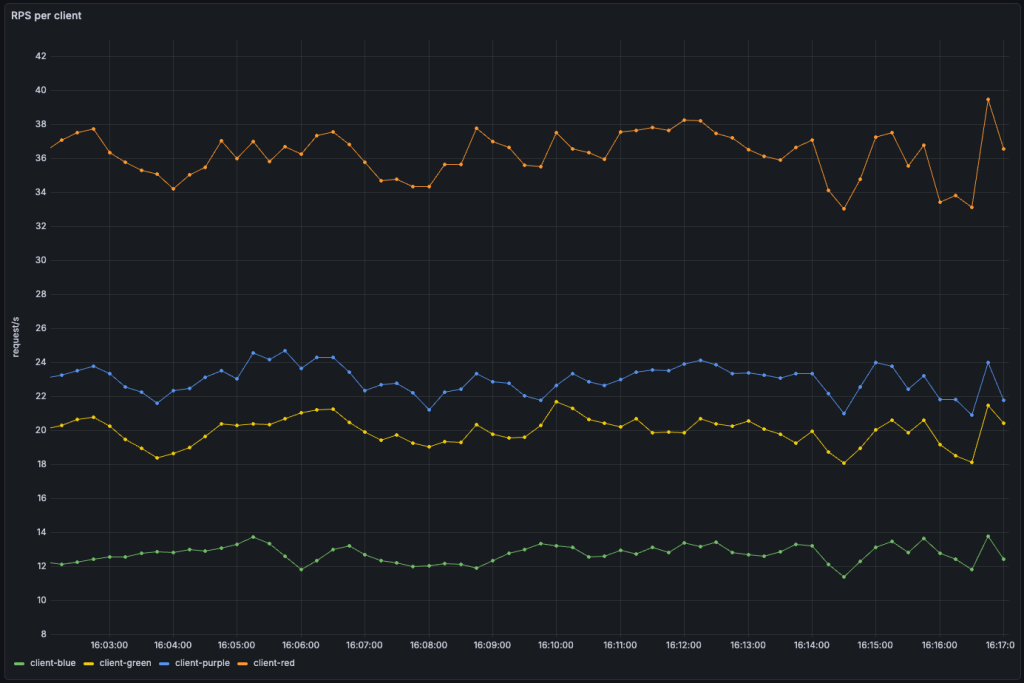
Knowing where agentic traffic is coming from can be equally as important as understanding what AI agents are doing. Large language models (LLMs) are a major source of agentic traffic on the internet. Insights into MCP throughput can reveal a need to block or rate-limit certain LLMs – such as those spawning shadow agents that are not known or unauthorized to access applications delivered by NGINX. In other scenarios, agentic clients might be part of the infrastructure under management. In these cases, disparities in traffic can inform network topologies, routing strategies, or additional infrastructure investments.
Try it now
Ready to dive in and enable agentic traffic monitoring in your infrastructure? We’ve created an easy-to-follow Docker compose-based reference implementation that enables you to stand all necessary components up with just a few commands. Follow this guide and you’ll be your way to understanding how AI agents access your systems and where they’re coming from in no time.
Agentic Observability is the foundation layer of AI capabilities in NGINX. In addition, last year we introduced Gateway API Inference Extension capabilities in NGINX Gateway Fabric, enabling inference‑aware routing for LLM and GenAI workloads in Kubernetes environments. We plan to continue building on this by providing new features enabling routing and other policy decisions based on agentic and inference AI traffic in NGINX, NGINX Ingress Controller, and NGINX Gateway Fabric later this year. In the meantime, we are extremely excited to hear your feedback on our new Agentic Observability features and see your contributions to our codebase!